Article
Case Study: Capturing Quality Images for ML Algorithm
This post was previously on the Pathfinder Software site. Pathfinder Software changed its name to Orthogonal in 2016. Read more.
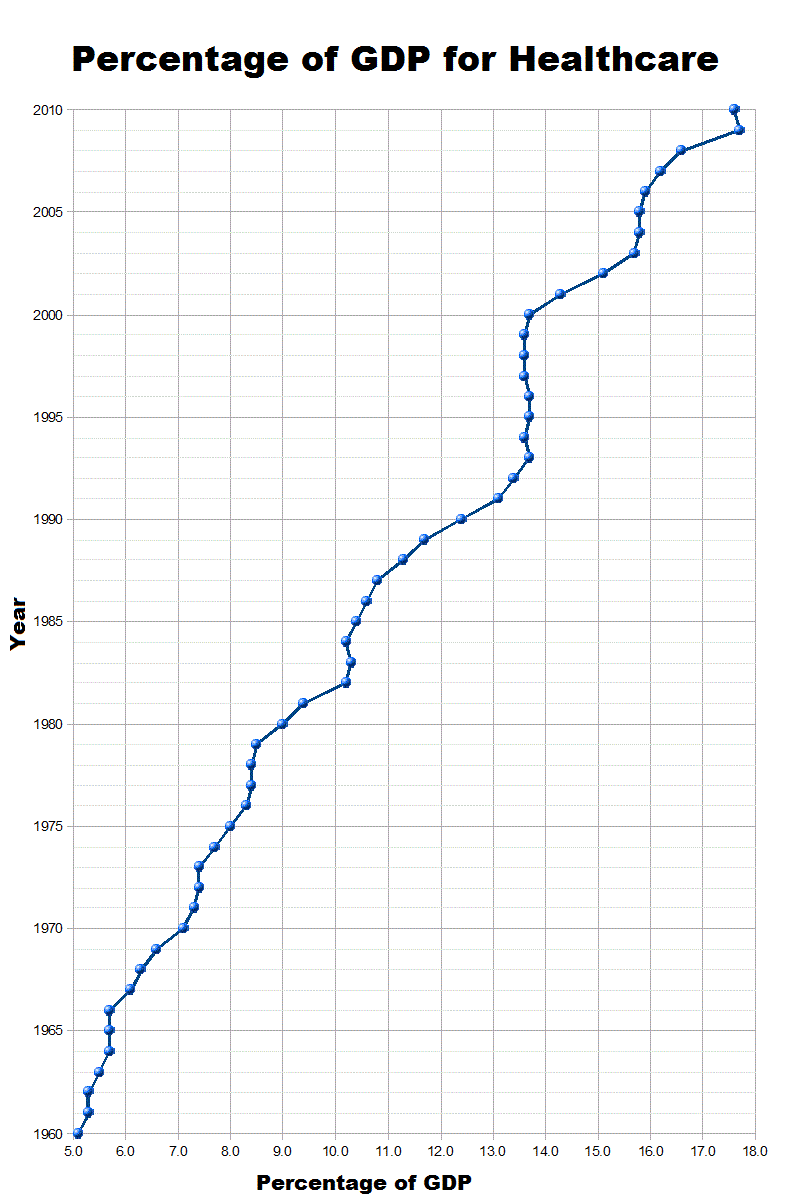
There’s a lot of discussion about ways to “bend the healthcare cost curve.” What do people mean by that, and why do we need to bend it?
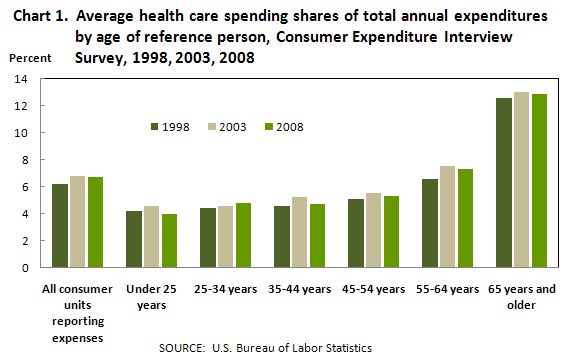
I like to answer that question by showing three simple charts.
1. The growth of Healthcare Expenses

2. Where we spend our healthcare dollars

3. What’s coming down the pike: the demographic timebomb
 Source: U.S. Administration of Aging 2010a.
Summary:
We’ve had a tripling of the share of healthcare costs as a percentage of GDP over the last 50 years, from 6% to 18%. We spend much more on healthcare for those over 65 than those under 65. Thanks to the aging of the baby boomers, we’re going to more than double the percentage of the population over 65.
You put these three factors together, and without significant changes, we are in trouble.
The good news is that there are promising approaches to reducing costs while improving outcomes, and a lot of smart, passionate people working on these approaches. We’re working with some of them on software to help address these challenges.
We’d love to hear from you on how you think of these challenges and what you’re doing to address them.

Related Posts

Article
Case Study: Capturing Quality Images for ML Algorithm

Article
Climbing the Mountain of Regulatory Documentation for SaMD

Article
You Had Me at Validation

Article
Building & Scaling a Successful Cybersecurity Culture