Article
Patient Engagement & UX for Bluetooth Medical Devices
This blog contains Chapter 1 of the Orthogonal white paper titled: Accelerating the Creation of Software as a Medical Device (SaMD) with Product Analytics. The following are links to each chapter of this white paper:
Data acquisition on how users are using your product can often be slow to obtain and not lend itself to large scale deployments or fast release updates. Product analytics is an integrated set of data about your users’ behaviors that allows you to analyze these behaviors, both at the level of the individual user and in aggregate to gain insights about larger patterns and trends.
More formally, Gartner defines product analytics as follows:
“Product analytics is a specialized application of business intelligence (BI) and analytical software that consumes service reports, product returns, warranties, customer feedback and data from embedded sensors to help manufacturers evaluate product defects, identify opportunities for product improvements, detect patterns in usage or capacity of products, and link all these factors to customers.”
The use of product analytics in MedTech is still nascent but holds tremendous promise to help turbocharge an evolution towards the frequent release of medical devices. In the context of Software as a Medical Device (SaMD) and other types of connected medical devices, product analytics add value in three different areas:

Product analytics is an integrated set of data about your users’ behaviors that allows you to analyze these behaviors, both at the level of the individual user and in aggregate, to gain insights about larger patterns and trends.
The value of product analytics is broadly recognized and captured in a number of business domains, such as subscription services and e-commerce, and is key to keeping company apps and solutions continually relevant, always improving, and “addictive.”
In the case of connected medical devices, product analytics starts with “instrumenting” your medical device’s user interface application to gain real-time insights into user interactions with your application. In other words, you add invisible triggers in specific places around your application that produce detailed logs of specific user behaviors. In addition, you capture properties of those users such as OS type, browser type, and country. Generally, firms execute this with a third-party software solution such as Mixpanel.
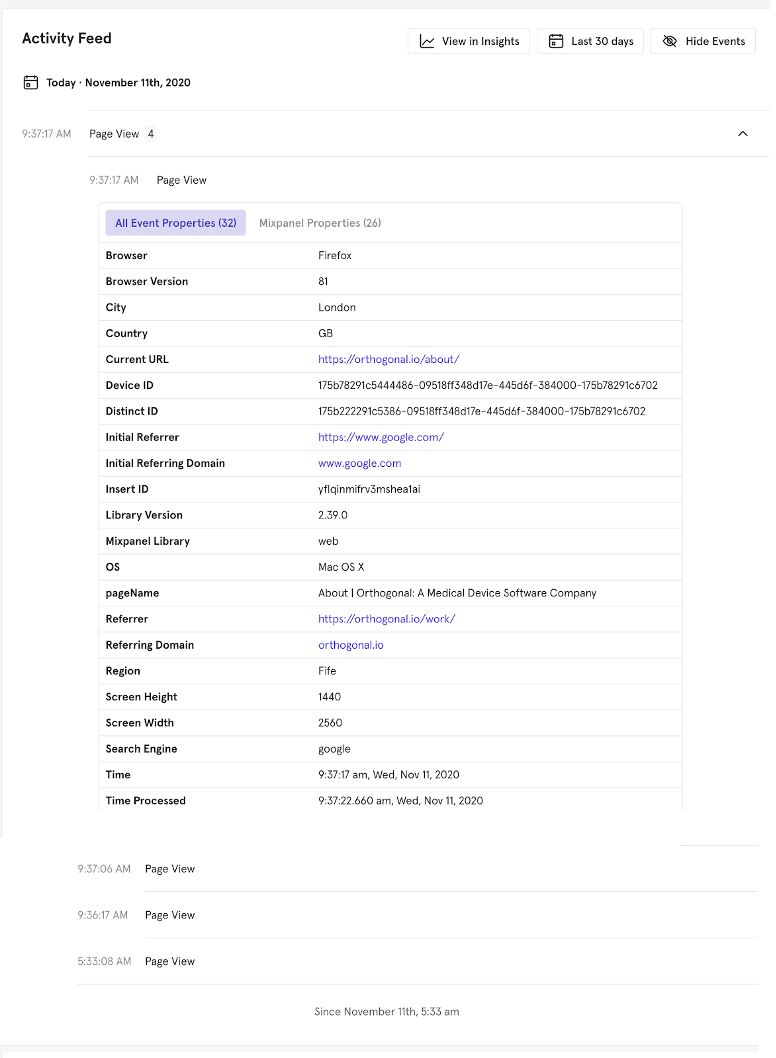
This is an anonymized example of one row of product analytics data created by a user’s visit to Orthogonal’s website. As you’ll see below, they arrived at our website via Google, and this is the fourth page they visited on a specific day. The record details their journey through our website, what kind of device they were using, and where they are located.

Often, product analytics data captured through these invisible tripwires in your application can be more valuable if you link data from other systems; when combined, this data becomes very robust. This linked, person-level data from multiple sources becomes even more valuable when some of those data points are used to segment your users by demographics, health data, or the type of smartphone used.
In the medical device space, the application of product analytics is still in its infancy. However, to get to frequent releases in the design and development of Software as a Medical Device (SaMD) and other connected medical devices, product analytics will need to become a standard tool in the toolboxes of R&D, human factors, and user experience (UX) professionals.
Product analytics helps answer key questions that would be difficult or impossible to otherwise answer such as:
To be clear, we do not see product analytics as a complete replacement for other types of qualitative and quantitative methods that we deploy for research, design, and validation.
We have been working with more rudimentary versions of product analytics products going back 12 years. As early as 2009, we saw the potential value of the product analytics concept and have worked with it intermittently, even if the early products were not very effective in their implementations. We are very methodical and technique-driven in our work and are constantly identifying new or alternative approaches; we work off of fundamental principles of good design that allow us to borrow, adapt, combine, fuse, and generally re-mix methods, based on experience and our understanding of the research challenge. Product analytics is a powerful tool in the toolbox that provides broad and deep data about real-world product use.
Product analytics can work together with other methods, especially qualitative methods, by uncovering insights into how users are navigating through the product. This information can then be used to design traditional human factors tests, which strive to further uncover the “why” behind what users are actually doing.
The data made available with product analytics has value across the complete medical device product lifecycle. At different stages of the lifecycle, the data can be used in different ways (i.e., different use cases) to create (novel) value. At a high level, we divide these use cases into three categories. Product analytics can be used to help with 1) device design and development, 2) device operations and end user support, and 3) helping users better use their device and improve their health outcomes.
Keep in mind two points before reading this list of examples:
First, product analytics’ value is in helping you track what is happening between your user and their device. Once you identify an interesting “what” (i.e. pattern) in this data, you still need to follow up with qualitative research to understand why that pattern is emerging in the data. You’ll need to determine the significance of the pattern and then decide what, if anything, you want to do in response to that insight.
Second, all use of product analytics must be thoughtfully integrated into the same mechanisms you use to ensure the effectiveness of your device and to protect the safety and privacy of the user/patient. This is where fast feedback loops such as Three User Thursdays become a very effective complement to product analytics.
Anytime that a person (i.e., user) is interacting with a connected medical device, the data that provides context for those interactions can be captured as the raw data for product analytics. There are numerous points in the device design and development lifecycle where this kind of data is being created.
To make an obvious point, the greater the number of users of the device, the more that data can be generated to create a richer input for insights. While product analytics could be used as part of an initial feasibility study for a new device, the study’s relatively small sample size will enrich the data available to the product team for those study participants, but expectations about the value of the data should be tempered. The following are all examples of ways that this type of analytics can be used to improve and accelerate the early design and development and subsequent enhancement of medical devices:
The greatest value of product analytics comes to bear once a connected medical device is approved and begins to be used as a “real” medical device. At that point, the data collection hooks that have been built into the device provide a tremendous tool for understanding how the device is actually being used (i.e., real-world data). For example, product analytics can tell you how often and where a user is activating contextual help, which can identify gaps in design or labeling usability. This data can then be used to guide the future support and evolution of the product (i.e., real-world evidence).
In addition to better understanding the actual usage of a medical device, product analytics can also be used to support the rapid testing of new versions of the product where the control group (i.e., Group A) continues to use the current device and the test group (Group B) uses a modified version of the product (either in development or as a new feature release to a limited group of users). With this data, their experiences and outcomes can then be compared to evaluate the new product idea on a regular basis, and the product development team can quickly react to these learnings and generate a new “B” test to quickly deploy and evaluate.
Product analytics also makes it easier to do more sophisticated segmentation of a devices’ user base, allowing for a more targeted analysis of current device usage and A/B testing of potential changes in the product.
Once a new version of a product is ready for a clinical trial, the built-in product analytics can enable a more ambitious and continuous clinical trial operation that speeds the time to approval of a device for new features and for the use of the device for new indications or features.
Put together, this means that you can launch a good medical device quickly and then use product analytics to enable you to iteratively and rapidly evolve and improve your product.
Anyone who has ever made a call to a technical support line for product assistance understands that it can be quite difficult for a remote technical support team to efficiently and effectively help you diagnose and resolve the issue. This is, in large part, because they can’t be physically with you and the device to observe firsthand what is going on. Real-time product analytics data post-launch can be useful for an operations team that’s supporting remote users by giving them real-time visibility into how exactly a user is interacting with a device. (Think of the difference between describing to someone what you are seeing in an application on your laptop and having them be able to log into your laptop, see what you are doing and remotely take control of your laptop to diagnose and fix an issue.)
Since all user data is stored in a single database, it also becomes much easier to develop a broader situational awareness of what is happening with all the devices currently in use. If, for example, a smartphone device maker releases a security update for a specific smartphone model that unintentionally breaks the connected device app, looking at aggregate data across all users can be much easier to pinpoint the common factors (e.g., smartphone model, OS version, language, geographic location, phone carrier, utilization of a common subset of application features) that could be the cause of the emerging issue. Given the highly dynamic nature of changes to smartphone hardware, OS versions, applications, and carrier-specific customizations (and so on), product analytics can help to identify, diagnose and pinpoint emerging operational issues.
As you read the previous paragraphs, you may have noticed that there is a fine line between end user support and adverse event reporting and management. As product analytics gains more traction in the connected medical device space, it may end up raising the bar for our industry on what is considered possible or necessary for good quality management processes for reporting and addressing adverse events.
The outcomes impact of medical devices, like other kinds of therapies, are often a “you get out what you put in” value proposition. In other words, just because a patient has a medical device, it doesn’t mean that they are guaranteed to take all the steps to maximize the diagnostic, monitoring, and/or therapeutic value they can get from the device. It’s the difference between device compliance or adherence and active engagement with a device.
Indeed, an entire specialty has sprung up around fusing the fields of user-centered design (e.g., design thinking), behavioral psychology and economics that looks at how we can borrow from the same methods used by social media companies to make their devices “addictive”, or methods by consumer products firms to make devices compelling enough to buy, and use those to nudge patients towards healthier behaviors.
This is where product analytics comes into focus. Commercial firms with products and services to sell have been the bedrock of the user base for product analytics, growing it from an impressive $6.9B market in 2019 to a twice-the-size projected $13.9B market by 2024. If medical device manufacturers can piggyback on this sophisticated, well-funded, and rapidly growing toolset, they can use product analytics data as a part of the patient care feedback loop that nudges and enables patients to make better use of their medical devices and achieve better healthcare outcomes.
Examples to illustrate this abstract point:
Example #1) Predicting and averting patient decline
It is possible that patterns in this data could be correlated with future, high-risk/high-impact declines in a patient’s health. For example, what if a medical device maker could:
Example #2) Identifying where patients are repeating known mistakes and helping prompt them to avoid future repeats… at a personalized level
At a more micro-level, a medical device could:
Example #3) The observer effect and gamification of health management
Scientists of many disciplines are aware of the observer effect where “the act of observing will influence the phenomenon being observed.” Sometimes simply sharing the data captured about a person’s use of a device with them is enough to change a behavior for the better. This was the unanticipated lesson from a research study of asthmatics that led to the now-famous Propeller Health case study in digital therapeutics, where researchers learned that simply by showing patients how they used (and didn’t use) their inhalers, they could be induced to use their inhalers better.
Others have taken these ideas to the next level through gamification, where the human instinct to compete is leveraged to induce people to improve their health statistics, relative to the benchmarks set by groups and the activities of others in their social circle. Witness how “step counting” became a group activity and a sort of cultural moment when Fitbit and others allowed the real-time measurement of human movement to become a digitally sharable score.
As an industry, we’ve just scratched the surface of what we will be able to achieve by playing product data back to the person to change their future health behaviors and outcomes.
Bob Moll is the principal UX Architect at Orthogonal. You can email him at bob@devorthogonal.wpengine.com
Ke Li Yew is an analyst at Orthogonal. You can email her at kyew@devorthogonal.wpengine.com
Randy Horton is the VP of Solutions & Partnerships at Orthogonal. You can email him to rhorton@devorthogonal.wpengine.com

This blog contains Chapter 1 of the Orthogonal white paper titled: Accelerating the Creation of Software as a Medical Device (SaMD) with Product Analytics. The following are links to each chapter of this white paper:
Related Posts

Article
Patient Engagement & UX for Bluetooth Medical Devices

Article
How Design Can Improve Ratings for Medical Device Apps

Article
5 Keys to Integrating UX Design With Agile for SaMD

Article
The Product Analytics Marketplace: SaMD Best Practices